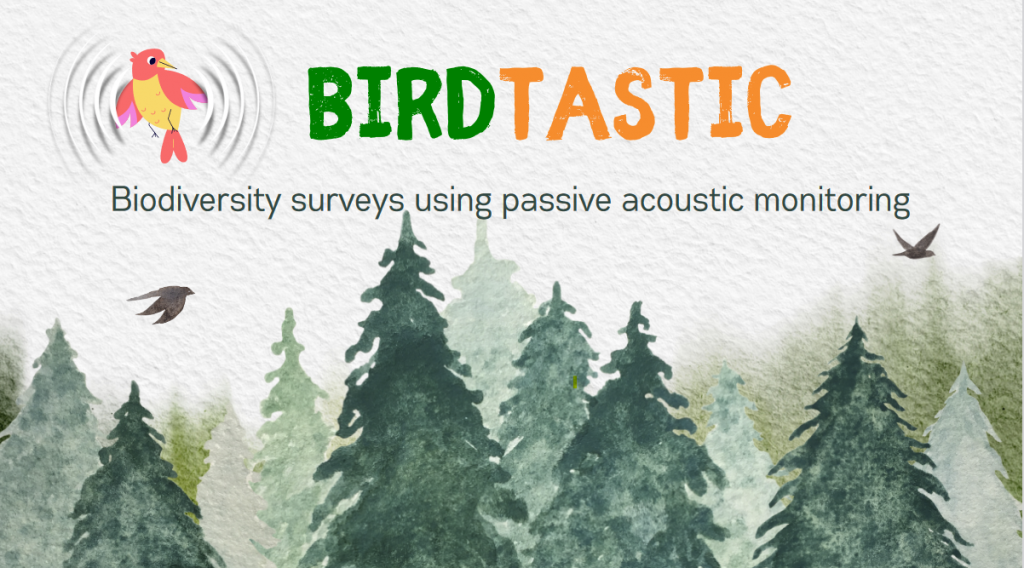
Birdtastic
A LITTLE BIT ABOUT MOI!

Namaste everyone! I am Anhad and I come from the IT hub of India, Bengaluru! I am a programming nerd, piano player and an avid hiker.
I’ve completed several courses from MIT OpenCourseWare and Zero to Mastery, earning certifications in machine learning, data science, and web development. My primary focus is on machine learning, with a special interest in healthcare applications
I’ve worked on several exciting projects, including a heart disease detection system, a dog breed classifier using TensorFlow, and an ASL translator called Sign2Save. With these projects, me and my team have had the privilege to earn several accolades such as the regional qualifier in Uber Global Hackathon and 1st place in Oberoi Hackathon This summer, I’m excited to start an internship with Boeing, where I look forward to applying my skills in real-world scenarios. My journey in STEM is driven by a passion for innovation and continuous learning, and I’m eager to see where it leads next.
Birds as biodiversity indicators
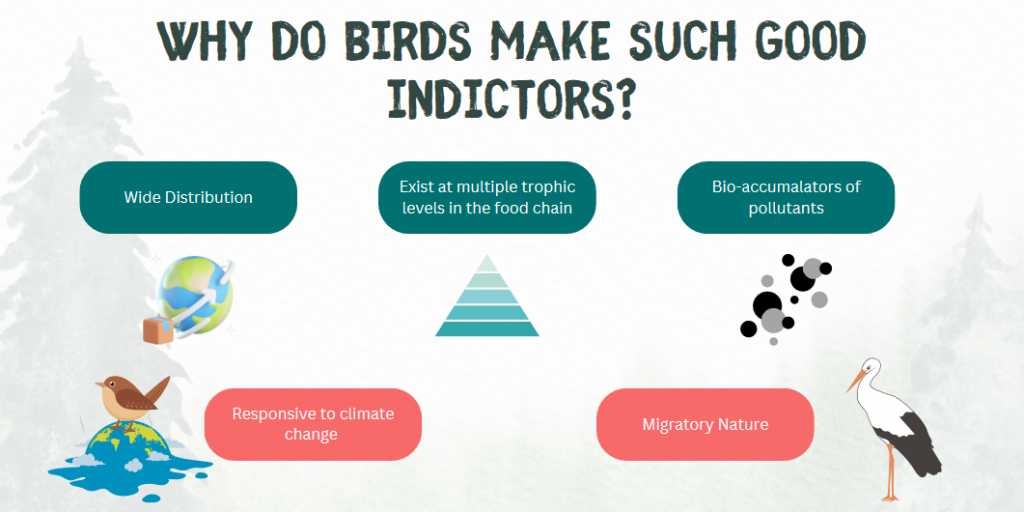
The level of biodiversity in an ecosystem refers to the variety of life forms in the ecosystem. A high level of biodiversity in an area is crucial for the stability of the ecosystem. Organisms are often interdependent on one another and the demise of one species often tends to bring down the entire food chain. To study biodiversity, scientists employ a variety of techniques – one of which is sampling the species of birds present in an area. Birds are excellent indicators for biodiversity in an area. These bird assemblage statistics (most of which are monitored by observers) allows them to understand biodiversity and see what real-world effects their biodiversity improvement programs are having. (Huang et al.)
WHAT’S THE ISSUE WITH OBSERVER-BASED MONITORING


What’s my solution?
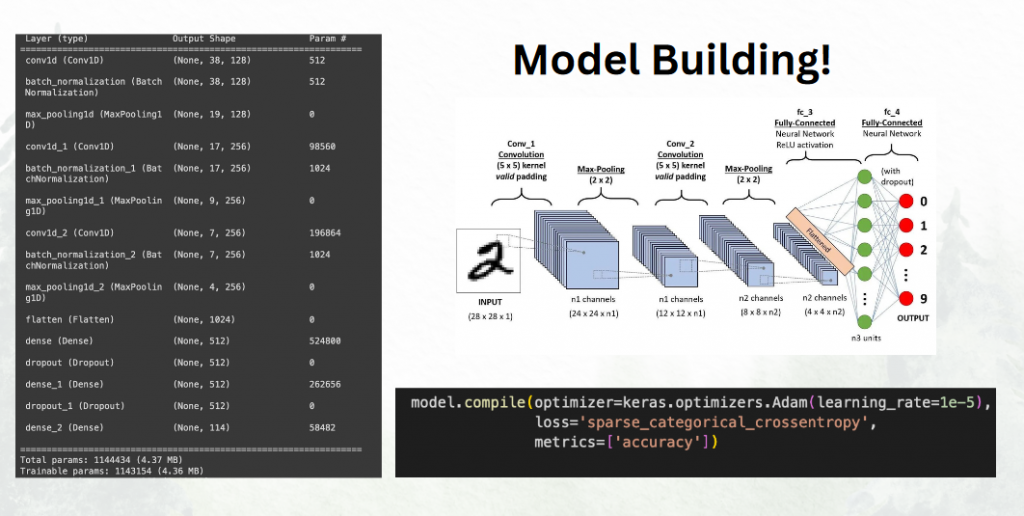
My solution involves leveraging the audio recordings of bird calls to accurately identify bird species. By building a deep learning model, specifically a convolutional neural network (CNN) designed for audio classification, we can analyze the unique sound patterns of different bird
species. CNNs are particularly well-suited for this task because they excel at identifying patterns in spectrograms, which are visual representations of audio signals. This approach not only eliminates the biases and limitations of traditional observer-based surveys but also
enables continuous, non-invasive monitoring across diverse and complex habitats, providing a more accurate and comprehensive assessment of bird populations.
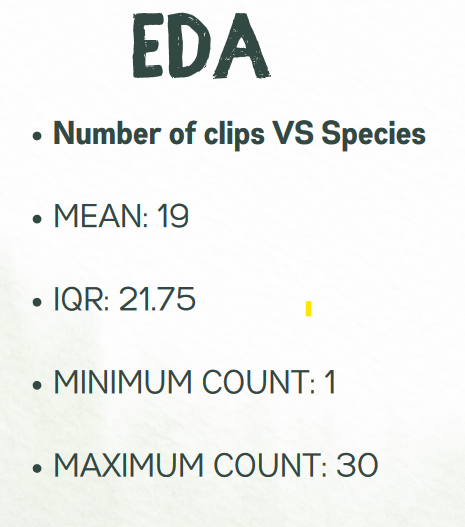
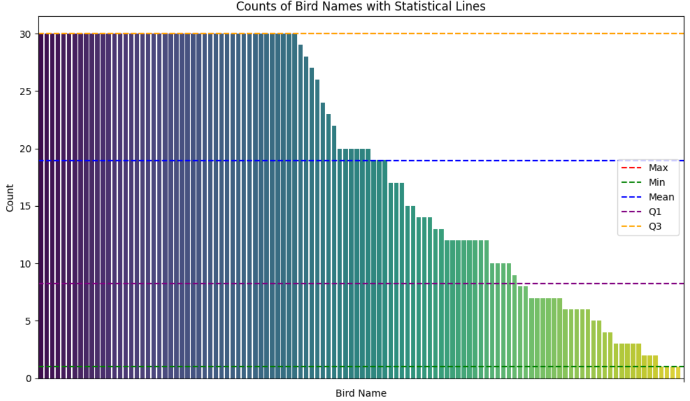
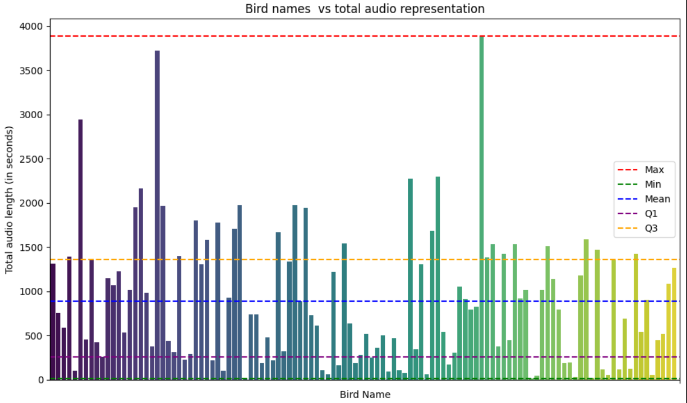
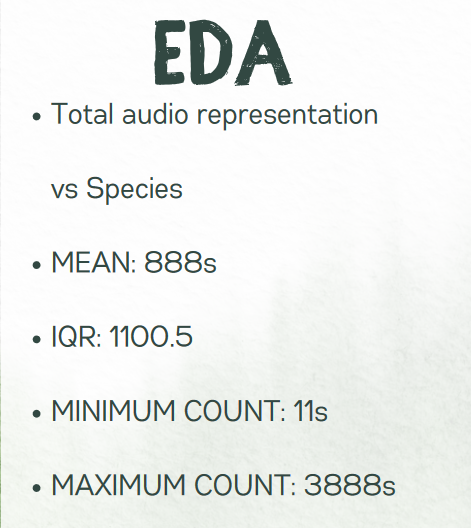
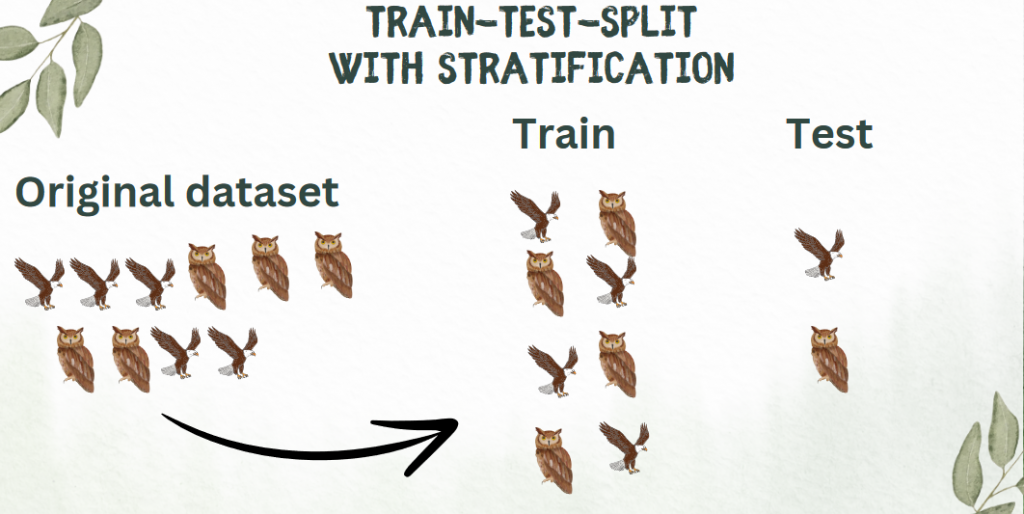
Dataset used
I have used a dataset of 2161 audio sounds totaling 2 GB in size, that
represents the bird calls of around 114 different birds. The dataset has been split in the ratio 8 : 1 : 1. The 8 parts would be utilized to actually train the model, whilst the other two parts would be used for validation (i.e. monitoring the performance during the training process) and test (evaluating the final performance of the model) respectively
MOVING FROM AUDIO TO IMAGES
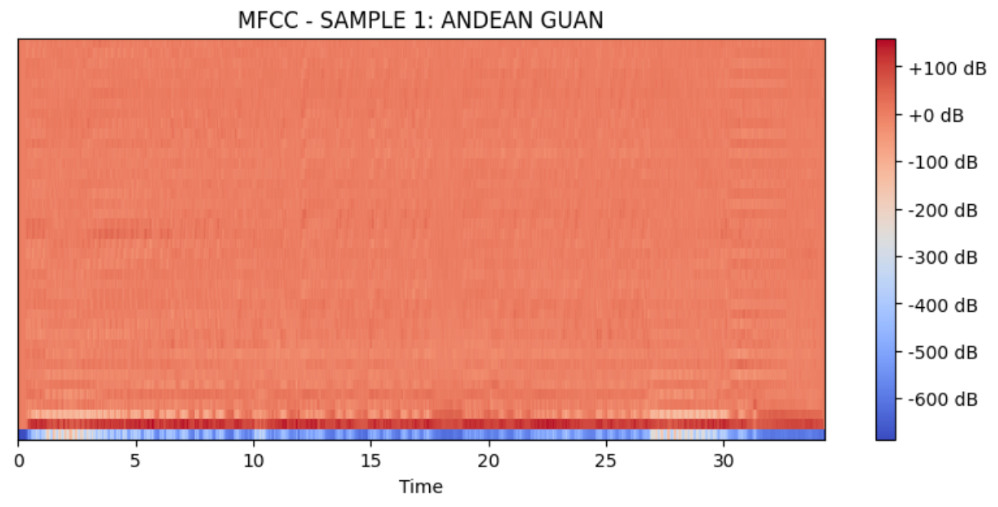
Convolutional neural networks (CNNs) are powerful tools for image recognition, but they inherently cannot directly process audio data. To enable CNNs to work with audio, we must first convert the audio signals into a format that CNNs can understand, typically images. This conversion is achieved through techniques like the extraction of Mel Frequency Cepstral Coefficients (MFCCs), which capture the timbre or color of a sound. By representing audio as spectrograms, which are essentially images depicting the intensity of different frequencies over time, we can feed this visual data into CNNs for classification tasks. MFCCs, by capturing the distribution of frequencies in the audio signal, serve as a feature representation that is analogous to the pixel values in an image. This approach allows us to effectively leverage the power of CNNs for audio classification tasks.
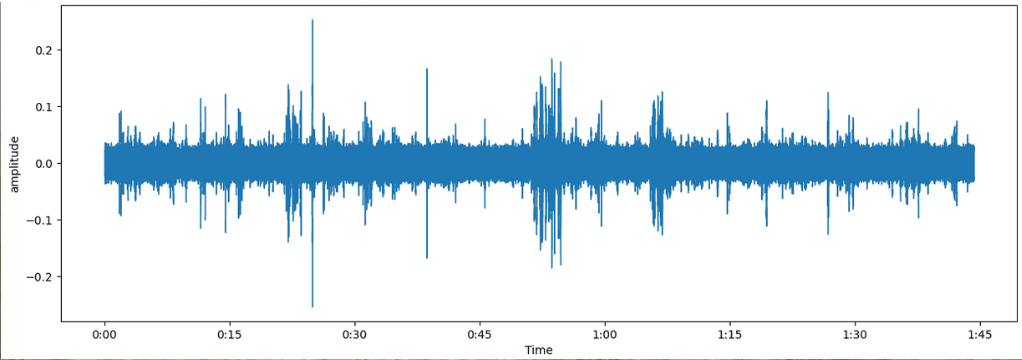
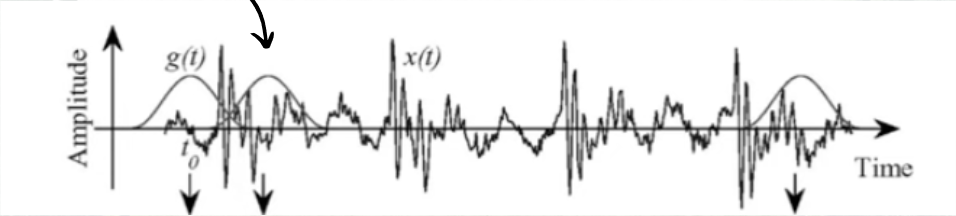
AMPLITUDE VS TIME SIGNALS
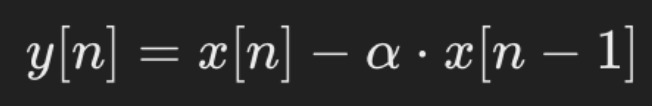
PRE-EMPHASIS FILTER
Pre-emphasis is implemented on the audio files in which the high-frequency complements of the signal are enhanced (since energy is distributed towards low
frequency signals quite often) while the low-frequency signals are unchanged
Out Signal
Current Signal
Pre-emphasis coefficient (0.9 – 0.97)
Previous Signal
Framing
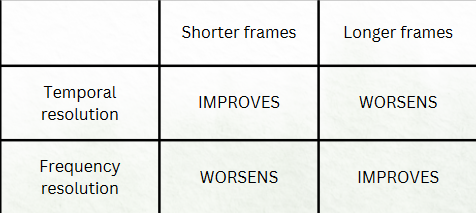
In my project, I have chosen to divide the audio clips into frames of 20ms each. Implementing a Fourier Transform directly on the entire clip would provide information about the frequencies present, but it wouldn’t indicate when these frequencies occur. This temporal information is crucial, as bird calls, for example, may start with high frequencies and transition to low frequencies or exhibit a mix of different frequencies over time. The choice of 20ms frame length ensures a balance between temporal resolution and frequency resolution. In addition to this, the frames are also overlapped by 50% (10ms) to ensure continuity
HUMMING WINDOW
When a signal is truncated or segmented by the process of framing – the discounties at the segmaent boundaries can cause spectral leakage. This occurs when energy from a signal’s true frequency components spreads to adjacent frequencies in the frequency domain. This could potentially damage our model’s accuracy. To mitigate this error, hamming window is implemented which tapers the beginning and end of a signal segment smoothly to zero (or nearly zero)
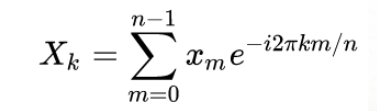
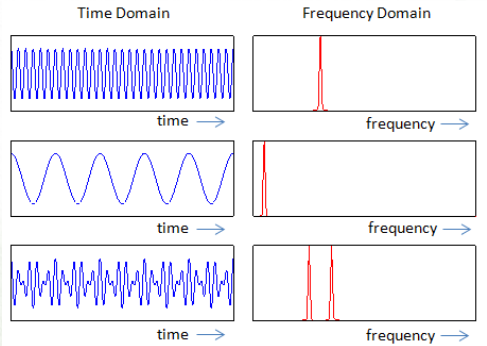
fAST FOURIER TRANSFORM
The windowed frames are transformed from the time domain to the frequency domain using the Fast Fourier Transform. This converts each frame into its frequency representation, proving information about the magnitude of different frequency components.
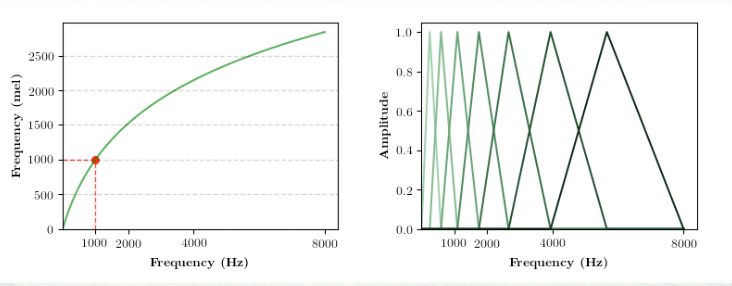
MEL FILTER BANK
The Mel filter bank is applied to the power spectrum obtained from the FFT. The filter bank consists of a series of triangular filters spcaed evenly along the mel scale., which is designed to mimic the non-linear human auditory system’s response to different frequencies. Humans can easily discern the difference between low freqs (100Hz – 200Hz) but have difficulty identifying difference between high frequencies (1000Hz – 1100Hz)
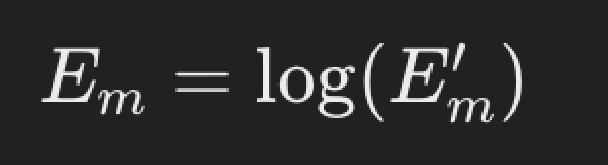
lOG COMPRESSION
After filtering, the logarithm of the filter bank energies is taken. This step compresses the dynamic range of the filter ank energies and further approximates to the human perception of loudness --> (Mel filter banks helped in converting to the human scale of frequency, this helps in converting to human scale of loudness which is logarithmic in nature)
DISCRETE COSINE TRANSFORM
The final step involves applying the DCT to the log filter bank energies. The DCT decorrelates the filter bank coefficients adn represents them in terms of cosine functions. Typically , the correlation between variables leads to redundancy where the information in one filter bank energy can somewhat be predicted from its neighbors. To reduce this redundancy and thereby reduce the dimensions of the dataset --> DCT is applied. The first few coefficients are usually kept (13 in our case) and the rest are discarded.
FINAL BITS OF PREPROCESSING
UNDERSTANDING RESULTS

MODEL LIMITATIONS AND IMPROVEMENTS
1. Model Architecture Optimization: While our current model architecture shows promising results, exploring alternative architectures such as recurrent neural networks (RNNs) or utilizing libraries like PyTorch Audio can potentially improve our model’s ability to capture temporal dependencies in bird audio data.
2. Dataset Expansion and Augmentation: Building a larger and more diverse dataset is crucial for enhancing our model’s generalization and accuracy. Augmenting the dataset with variations such as changes in bird positions can further improve its robustness to real-world scenarios. 3. Representation of Underrepresented Species: To ensure our model can accurately classify a wide range of bird species, we need to actively seek out recordings of underrepresented species and incorporate them into our training data. This will help avoid biases towards more commonly observed species.
4. Optimizer Selection and Hyperparameter Tuning: Fine-tuning our model’s hyperparameters, including the choice of optimizer and learning rates, can significantly enhance its convergence and performance on bird audio classification tasks.
5. Transfer Learning with YAMNet: Leveraging pre-trained models like YAMNet through transfer learning can expedite our model development process and improve performance by transferring knowledge learned from large-scale audio datasets.
6. Addressing Model Uncertainty and Hallucinations: While our model achieves high accuracy, it’s essential to recognize that no model is perfect. Occasionally, our model may misclassify sounds or “hallucinate” interpretations. Incorporating a mixture of human observers alongside automated audio classification can help validate our model’s predictions and correct errors.
7. Expansion to Other Bird Species and Beyond: As our model matures, we can explore expanding its capabilities beyond current bird species classification to include other avian species. Furthermore, extending our model to classify audio from other creatures, such as amphibians or mammals, can contribute to broader
biodiversity monitoring efforts.