Semantic Segmentation in Medical Scans for Gastrointestinal Cancer

Sepehr Eslami
Gastrointestinal Cancer
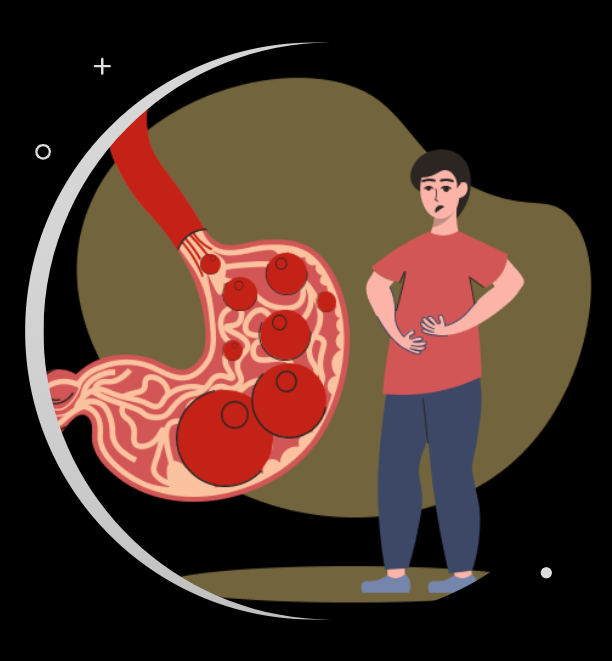
Gastrointestinal Cancer
An estimated 5 million people worldwide were diagnosed with gastro-intestinal tract cancer in 2019. Approximately half of these patients qualify for radiation therapy, which is typically delivered over 10 to 15 minutes per day for 1 to 6 weeks.
Abstract
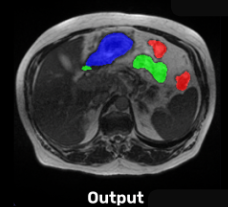
Semantic segmentation in medical scans for gastrointestinal cancer.
Focus on deep learning methods to automate segmentation in IMRI scans.
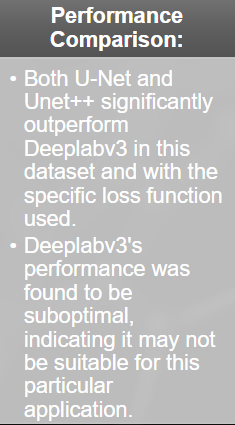
Comparison of Unet, Unet++ with different encoders, and Deeplabv3.
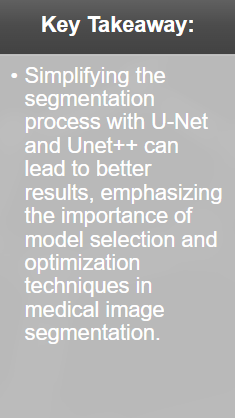
Objectives: Simplify segmentation, reduce treatment time, improve patient tolerance.

Objectives
- Automate Segmentation: Develop an automated process for segmenting the stomach and intestines in MRI scans to assist radiation oncologists.
- Reduce Treatment Time: Significantly reduce the time required for planning radiation therapy sessions from hours to minutes.
- Improve Accuracy: Enhance the precision of targeting tumors while avoiding healthy organs to improve patient outcomes.
- Increase Accessibility: Make advanced segmentation tools available to more clinics and hospitals, especially in under-resourced areas.
Introduction
Convolution Layer:
- The convolution layer detects patterns such as edges or textures within an image by sliding a filter across the image and analyzing small sections at a time.
- The filter multiplies its parameters with the corresponding pixel values, producing a single output value for each position, resulting in a new representation that highlights important features.
- Through training, the network learns to adjust the filter’s parameters to best capture features relevant to the task.
Encoder-Decoder Model:
- The model consists of two parts:
- Encoder: Reduces the dimension of feature maps, capturing long-range information in the deeper layers.
- Decoder: Gradually recovers object details and spatial dimensions, reconstructing the image with precise localization.
Dataset
- 5 million people diagnosed with gastrointestinal cancer in 2019.
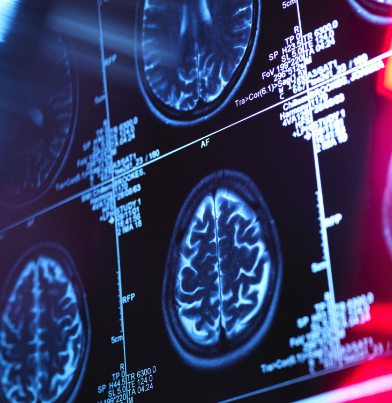
- IMRIs and MRLinacs visualize the tumor and intestines daily.
- Manual segmentation is labor-intensive and time-consuming.
- The code is available
- https://github.com/Se2007/MedicalImage-Segmentation

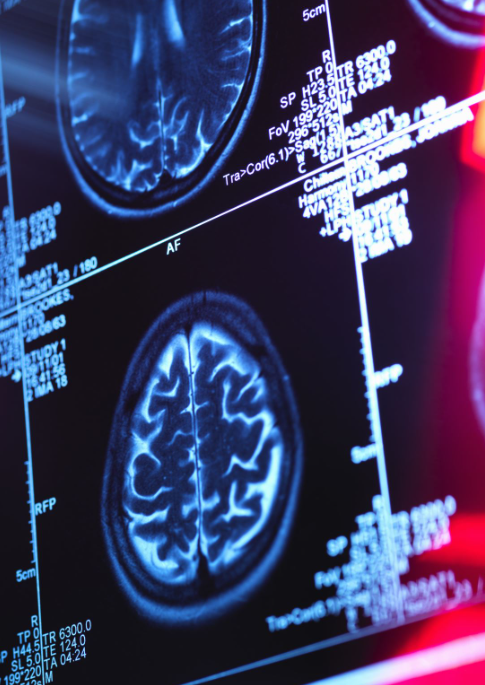
Information of this problem
- Radiation oncologists attempt to deliver high doses with X-ray beams aimed at tumors while avoiding stomachs and intestines.
- Nowadays, with MRI scans ,oncologists can visualize the day-to-day position of the tumor and intestines. The position can vary from day to day.
Target of project
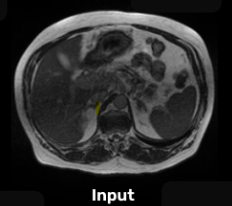
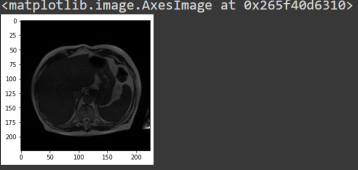
In these scans, the radiation oncologists have to manually outline the location of stomach and intestines in order to adjust the x-ray beam direction to deliver the dose to the tumor while avoiding stomach and intestines. This is a labor-intensive and time-consuming process that can increase the duration of treatment from 15 minutes per day to an hour per day, making it difficult for the patient to tolerate.
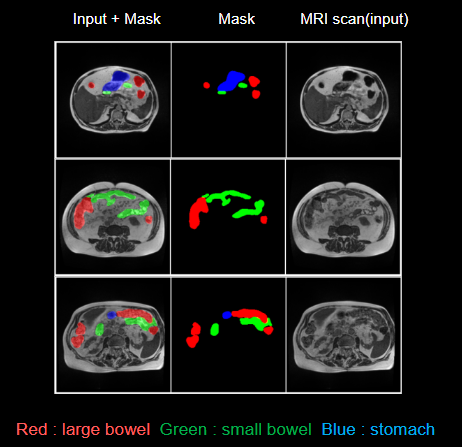
Segmentation of the stomach and intestine would significantly reduce the time needed for treatment and would enable more patients to receive more effective treatment.
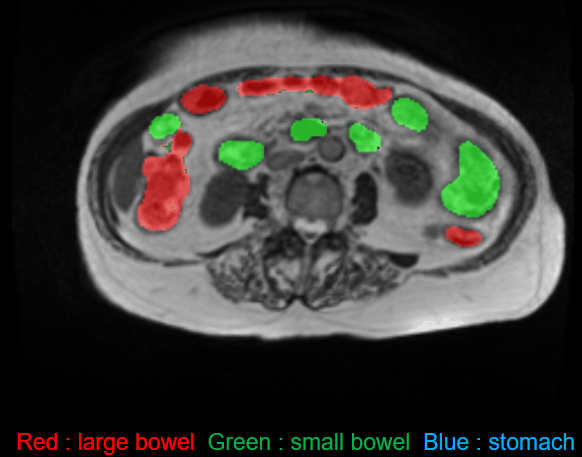
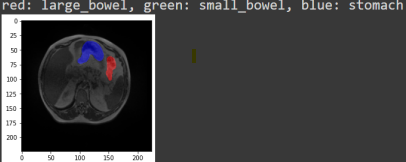
Data Sample
Evaluate Data Analysis (EDA)
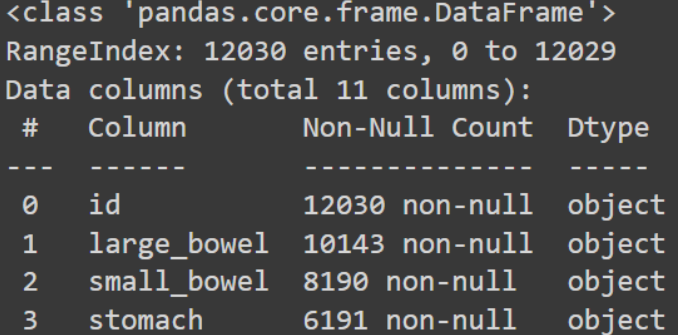
This indicates that there are 12030 data in our dataset, and each of those data has at least one of the three components—large bowel, small bowel, and stomach. While some data may have two, at least one, some may have all three. As you can see, 6191 MRI scans have stomachs, making up half of our dataset with stomach. 10143 data have large bowel, and 8190 data have small intestinal MRI scans
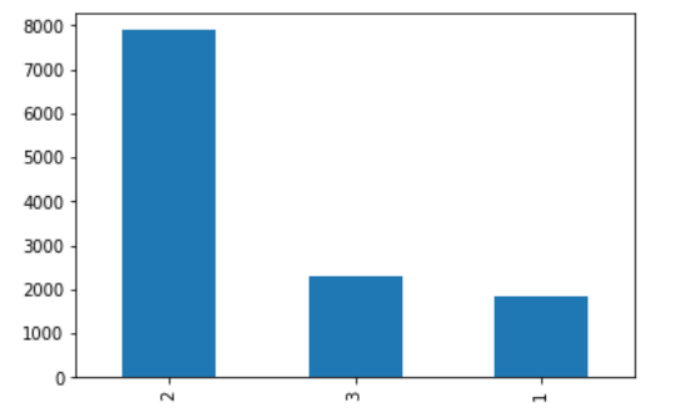
According to this graphic, around 8000 MRI scans have two classes or segments, approximately 2500 data have three classes or segments combined, and 2000 data contain only one segment.
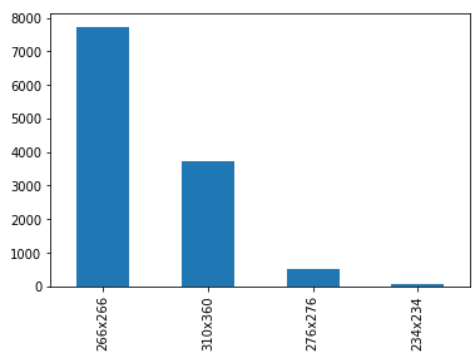
This figure indicates that there are four distinct image sizes in this dataset, with the majority of the data having a size of 266*266. This information can help us resize the dataset throughout the training process so that all the data is the same size.
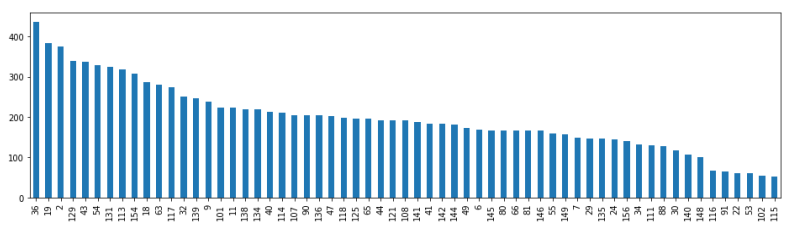
The patient IDs are displayed on the x-axis, and the number of MRI scans for each patient is represented on the y-axis. There are 61 patients in the entire dataset, and the highest number of MRI scans performed is 400. The number of treatment days determines the quantity of MRI scans (data).
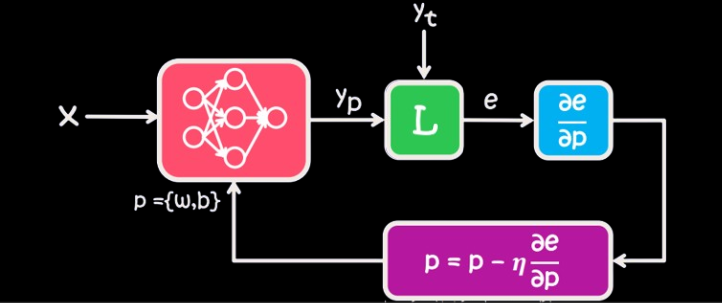
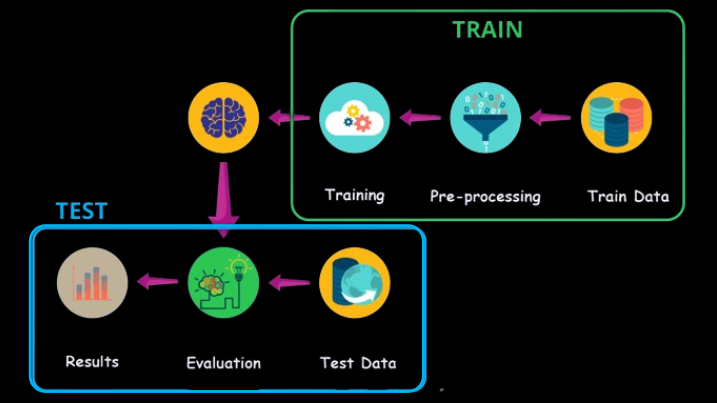
Training Process
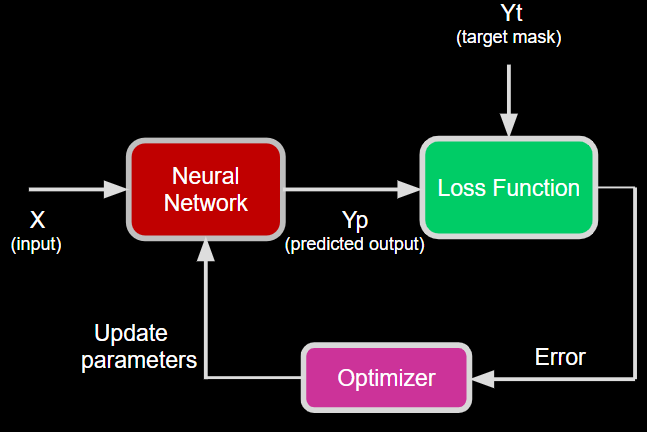
Diagram of Train
Related Work
Optimizer: Stochastic Gradient Descent (SGD) with momentum.
Loss Functions: Dice Function, Tversky, Cross-Entropy.
Metrics: Dice coefficient used for comparison.
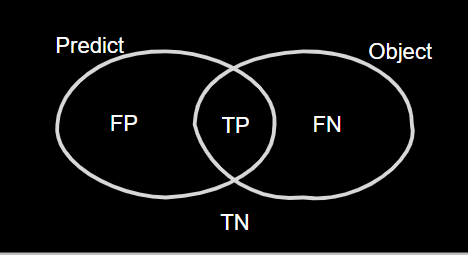
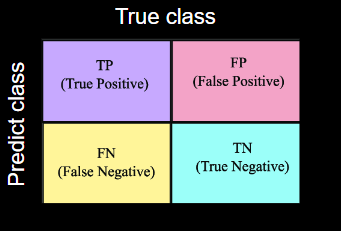
Confusion Matrix
For some loss function and metrics, you need to know the concept of the TP TN FP FN table Figure 1. TP is when the model predicts the true object and those part of the object have background label is FN and each part of the object that have background label is FP and for actual background that have true label is TN
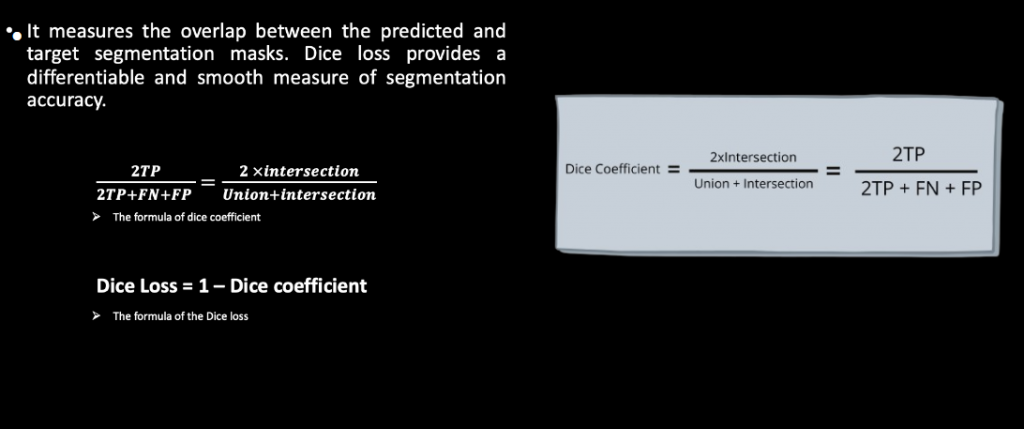
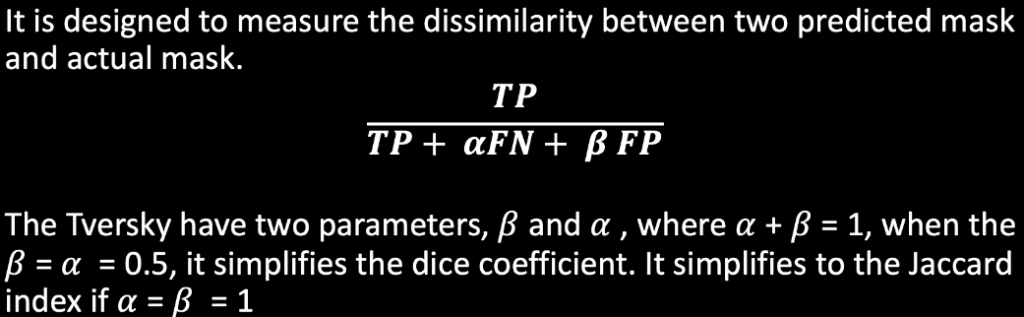
Dice loss function
Tversky
Methods
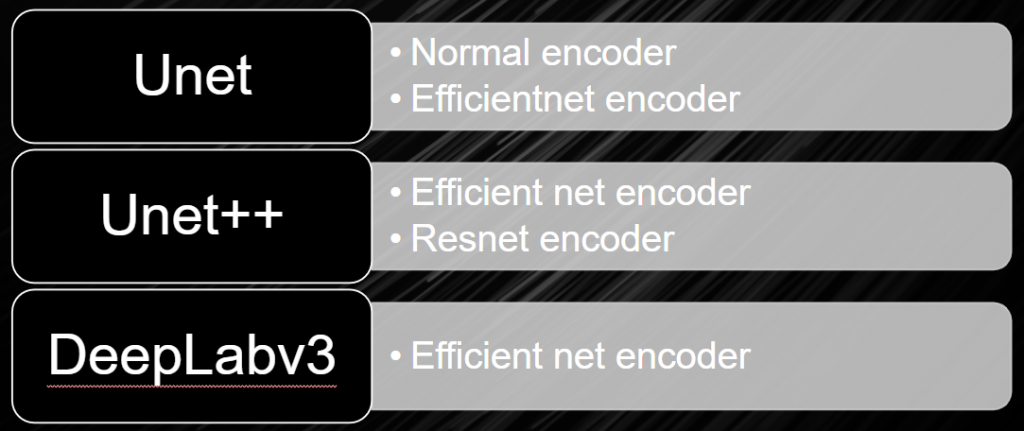
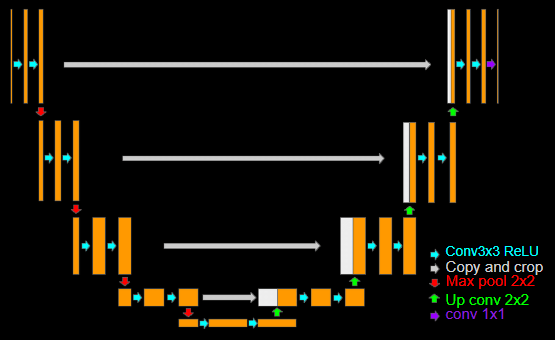
Unet
In simple word this architecture has encoder decoder structure and for encoder it is extract the feature map from input However, the decoder contains an up-sampling layer to create a mask, but it is missing details during up sampling. To address this, it adds the mirroring feature map from encoded at each stage of up sampling.
Unet ++
They’re adding a bunch of nested skip pathways to connect different parts of the network. The idea is to make sure the information from the beginning of the network matches up better with what’s needed later on.
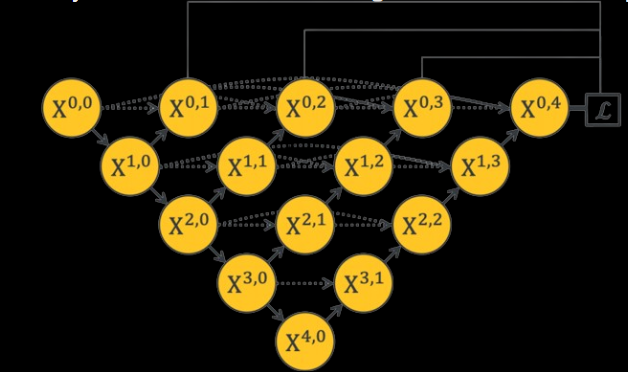
They’re also using dense convolution blocks to make sure the details from the input get carried through to the output. This helps keep the information consistent as it moves through the network. Additionally, they’re using deep supervision, which helps with training and pruning the model by using multiple loss layers. This makes sure the gradients flow smoothly during training.
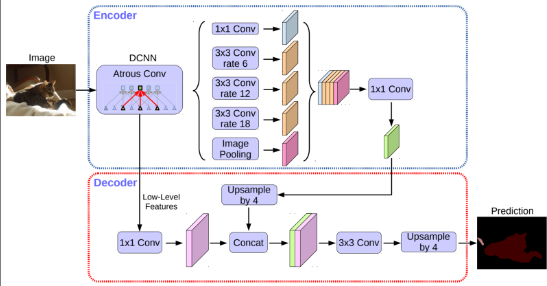
DeepLabv3
They use atrous convolution, which spaces out the filter elements to capture more context without adding extra parameters. This helps in understanding images at different scales.
Atrous convolution is like regular convolution, but with holes in between the elements, controlled by the dilation rate. It’s useful because it extracts dense features, offers control over the receptive field, and keeps the same number of parameters as regular convolution.
Plan of getting result
Experimental Evaluation
Comparison of U-Net, Unet++, and Deeplabv3 using the Efficientnet encoder.
Metrics: Dice coefficient.
Refer to the PDF for details.
Innovation Aspect
AI-Driven Segmentation: Utilizing advanced neural network architectures.
Practical Application: Real-time processing and clinical integration.
Improved Accuracy: Enhanced precision in targeting tumors and avoiding healthy organs.
Link to Sustainable Development Goals (SDGs)


Conclusion